Pro Dashboard: Multi-Condition Market Analysis
The Problem
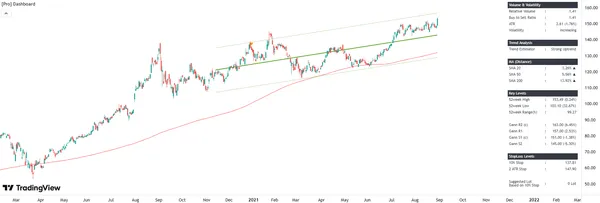
Professional trading groups needed to monitor 4 distinct market conditions (Trend, Volume, Volatility, Key Levels) across multiple timeframes simultaneously. Standard charts were cluttered, making rapid decision-making inefficient.
How I Solve This
I structured requirements to categorize essential data, designed a high-density tabular UI wireframe, and implemented 'at-a-glance' logic. The solution condenses 20+ data points (including Regression Channels, Dollar Normalized Volume, and Gann Grids) into a single, clean panel.
The Outcome
Delivered a 'Pro Dashboard' utility that reduces daily analysis time by ~40%. It became the central tool for the client's morning routine, allowing for immediate assessment of market conditions without switching charts.
BA Notes: Multiple discussions with several traders allowed me to understand what they actually need to see over what they want to see. This made it easier to determine which information was truly essential and should be included in the dashboard for monitoring purposes.