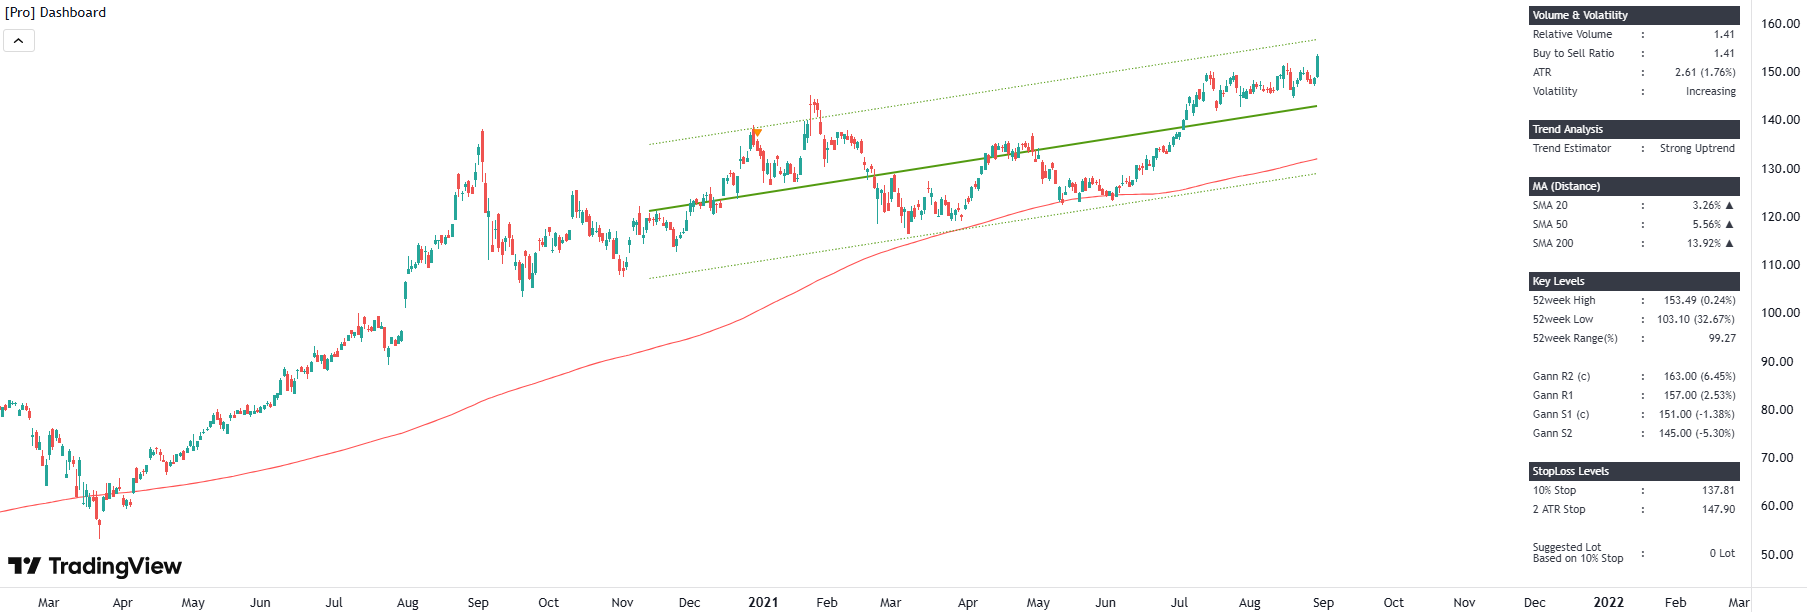
The Pro Dashboard is a powerhouse utility script designed to provide a complete overview of market conditions in a single panel. It features Trend Analysis using Regression Channels (Short, Mid, Long term), Volume & Volatility metrics (including 'Dollar Normalized Volume' and 'Buy/Sell Ratio'), and Key Levels (52-week High/Low and dynamic Gann Grids). It also includes a built-in position sizing calculator and moving average distance tracker, making it an essential tool for serious traders who need data density without chart clutter.
// This source code is subject to the terms of the Mozilla Public License 2.0 at https://mozilla.org/MPL/2.0/
// © fareidzulkifli
//@version=4
study(title="[Pro] Dashboard", shorttitle="[Pro] Dashboard", overlay = true, max_bars_back=800)
// ▼▼▼▼▼▼▼▼▼▼▼▼▼▼▼▼▼▼▼▼▼▼▼▼▼▼▼▼▼▼▼▼▼▼▼▼▼▼▼▼▼▼▼▼▼▼▼▼▼▼▼▼▼▼▼▼▼▼▼▼▼▼▼▼▼▼▼▼▼▼▼▼▼▼▼▼▼▼▼▼▼▼▼▼▼▼▼▼▼▼▼▼▼▼▼▼▼▼▼▼▼▼▼▼▼▼▼▼▼▼▼▼▼▼▼▼▼▼▼▼▼▼▼▼
// Parameters
// ▲▲▲▲▲▲▲▲▲▲▲▲▲▲▲▲▲▲▲▲▲▲▲▲▲▲▲▲▲▲▲▲▲▲▲▲▲▲▲▲▲▲▲▲▲▲▲▲▲▲▲▲▲▲▲▲▲▲▲▲▲▲▲▲▲▲▲▲▲▲▲▲▲▲▲▲▲▲▲▲▲▲▲▲▲▲▲▲▲▲▲▲▲▲▲▲▲▲▲▲▲▲▲▲▲▲▲▲▲▲▲▲▲▲▲▲▲▲▲▲▲▲▲▲
col1 = "No", col2 = "Yes",
txt_sz1 = "Large", txt_sz2 = "Normal", txt_sz3 = "Small"
_n = "No", _y = "Yes"
line1 = "1", line2 = "2", line3 = "3", line4 = "4"
typ1 = "Solid", typ2 = "Dashed", typ3 = "Dotted"
ext1 = "Don't Extend", ext2 = "Extend Left"
grp0 = "Table Settings"
grp1 = "Chart Assistance"
grp2 = "Content Settings"
grp3 = "Styling"
help1 = "Highlight row if current price near key levels\nGreen if above level\nRed if below level"
help2 = "Based on Gann Square of 9"
in_theme = input("Light", title = "Theme", group=grp0, inline="pnl1", options=["Light", "Dark"])
in_color = input(col1, title = "Highlight", group=grp0, inline="pnl1", options=[col1, col2], tooltip=help1)
in_size = input(txt_sz2, title = "Size ", group=grp0, inline="pnl2", options=[txt_sz1, txt_sz2, txt_sz3])
in_loc = input("Top", title = "Position ", group=grp0, inline="pnl2", options=["Top", "Bottom"])
in_gap = input(0, title = "Gap ", group=grp0, inline="pnl3", minval = 0, maxval = 7, tooltip="Increase the gap between Dashboard and Right Panel")
disp_mark = input(true, title = "Display Swing High/Low", group=grp1)
disp_vol = input(true, title = "Display Volume & Volatility", group=grp2)
vol_typ = input(_n, title = " Display as DNV", group=grp2, options=[_y, _n], tooltip="Dollar Normalized Volume\nPrice * Volume")
vol_triv = input(_n, title = " Display Volume & Average", group=grp2, options=[_y, _n])
atr_triv = input(_n, title = " Display ATR & Volatility", group=grp2, options=[_y, _n])
vol_len = input(20, title = " Avg Volume Length", group=grp2)
atr_len = input(14, title = " ATR Length", group=grp2)
disp_ta = input(true, title = "Display Trend Analysis", group=grp2)
disp_risk = input(_y, title = " Short-term Risk", inline = "risk", group=grp2, options=[_y, _n])
disp_ocl = input(_y, title = " Trend Estimator", inline = "ocl", group=grp2, options=[_y, _n])
disp_ocl_l = input(_n, title = " Draw Channel (L)", group=grp2, options=[_y, _n], tooltip="Longterm Regression Channel\nWARNING: Channel repaint on each new bar.\nChannel used for determining Trend Direction\nDO NOT use as S/R levels")
disp_ocl_m = input(_n, title = " Draw Channel (M)", group=grp2, options=[_y, _n], tooltip="Midterm Regression Channel\nWARNING: Channel repaint on each new bar.\nChannel used for determining Trend Direction\nDO NOT use as S/R levels")
disp_ocl_s = input(_n, title = " Draw Channel (S)", group=grp2, options=[_y, _n], tooltip="Shortterm Regression Channel\nWARNING: Channel repaint on each new bar.\nChannel used for determining Trend Direction\nDO NOT use as S/R levels")
disp_tplus = input(_y, title = " T+ ", inline = "T+", group=grp2, options=[_y, _n])
disp_trnd = input(false, title = "Display MA Distance", group=grp2)
reverse_dist= input(_n, title=" Reverse Distance Calculation", options = [_y, _n], group=grp2, tooltip="If Reverse is Yes, Calculation will be based on Price instead of MA")
MAtype = input("%", title=" Display Type ", options = ["%", "ATR"], group=grp2)
MA1type = input("MA", title=" MA 1", options = ["MA","EMA","WMA","RMA","VWMA", "Super Smoother"], inline=line1, group=grp2)
MA1len = input(20, title="", inline = line1, group=grp2)
disp_ma1 = input(false, title="", inline = line1, group=grp2)
MA2type = input("MA", title=" MA 2", options = ["MA","EMA","WMA","RMA","VWMA", "Super Smoother"], inline=line2, group=grp2)
MA2len = input(50, title="", inline = line2, group=grp2)
disp_ma2 = input(false, title="", inline = line2, group=grp2)
MA3type = input("MA", title=" MA 3", options = ["MA","EMA","WMA","RMA","VWMA", "Super Smoother"], inline=line3, group=grp2)
MA3len = input(200, title="", inline = line3, group=grp2)
disp_ma3 = input(false, title="", inline = line3, group=grp2)
MA4type = input("MA", title=" MA 4", options = ["MA","EMA","WMA","RMA","VWMA", "Super Smoother"], inline=line4, group=grp2)
MA4len = input(150, title="", inline = line4, group=grp2)
disp_ma4 = input(false, title="", inline = line4, group=grp2)
show_ma4 = input(_n, title=" *Show MA 4 in Panel", group = grp2, options=[_y, _n])
disp_key = input(false, title = "Display Key Levels", group=grp2)
disp_52w = input(_y, title = " Show 52 Weeks", inline = "52w", group=grp2, options=[_y, _n])
disp_52wl = input(false, title = "", inline = "52w", group=grp2)
disp_gan = input(_y, title = " Show Gann ", inline = "gan", group=grp2, options=[_y, _n])
disp_ganl = input(false, title = "", inline = "gan", group=grp2)
disp_cl = input(false, title = "Display CutLoss Levels", group=grp2)
var allow_short = _n
in_pctcl = input(10, title = " CL in %", group=grp2, minval=1., maxval=99.9)
in_atrcl = input(2., title = " CL in ATR Multiplier", group=grp2, minval=0.2, maxval=10)
disp_cal = input(_y, title = " Show Lot Calculator?", group=grp2, options = [_y, _n])
in_caltype = input("%", title = " Risk Based on: ", group=grp2, options = ["%", "ATR"])
in_calamt = input(1000., title = " Risk Per Trade (RM):", group=grp2, minval=50.)
in_calres = input("Lot", title = " Show As:", group=grp2, options = ["Lot", "Unit"])
in_callot = input(100, title = " Unit per Lot:", group=grp2, minval=1)
ma1_pcol = input(color.new(color.green, 0), title="MA 1 Color ", group=grp3)
ma2_pcol = input(color.new(color.blue, 0), title="MA 2 Color ", group=grp3)
ma3_pcol = input(color.new(color.red, 0), title="MA 3 Color ", group=grp3)
ma4_pcol = input(color.new(color.orange, 0), title="MA 4 Color ", group=grp3)
w52_sty = input(typ1, title="52 Week Line ", inline = "52w style", group=grp3, options=[typ1, typ2, typ3])
w52_col = input(color.new(color.orange, 0), title="", inline = "52w style", group=grp3)
gann_no = input(3, title="Gann Line No", inline = "gannsty", group=grp3, minval=1, maxval=10)
gann_sty = input(ext1, title="", inline = "gannsty", group=grp3, options=[ext1, ext2])
gann_col = input(color.new(color.aqua, 0), title="", inline = "gannsty", group=grp3)
// ▼▼▼▼▼▼▼▼▼▼▼▼▼▼▼▼▼▼▼▼▼▼▼▼▼▼▼▼▼▼▼▼▼▼▼▼▼▼▼▼▼▼▼▼▼▼▼▼▼▼▼▼▼▼▼▼▼▼▼▼▼▼▼▼▼▼▼▼▼▼▼▼▼▼▼▼▼▼▼▼▼▼▼▼▼▼▼▼▼▼▼▼▼▼▼▼▼▼▼▼▼▼▼▼▼▼▼▼▼▼▼▼▼▼▼▼▼▼▼▼▼▼▼▼
// Variables
// ▲▲▲▲▲▲▲▲▲▲▲▲▲▲▲▲▲▲▲▲▲▲▲▲▲▲▲▲▲▲▲▲▲▲▲▲▲▲▲▲▲▲▲▲▲▲▲▲▲▲▲▲▲▲▲▲▲▲▲▲▲▲▲▲▲▲▲▲▲▲▲▲▲▲▲▲▲▲▲▲▲▲▲▲▲▲▲▲▲▲▲▲▲▲▲▲▲▲▲▲▲▲▲▲▲▲▲▲▲▲▲▲▲▲▲▲▲▲▲▲▲▲▲▲
//------------------------------
var t_demo = in_loc == "Top" ? position.bottom_right : position.top_right
var proversion = true
var isdemo = false
if barstate.isfirst and proversion==false
if syminfo.type == "stock" and timeframe.period=='240'
isdemo := true
else if timeframe.period == "30"
isdemo := true
else
isdemo := false
proversion:=isdemo
//------------------------------
var dark = in_theme == "Dark" ? true : false
var text_size = in_size == txt_sz1 ? size.normal : in_size == txt_sz2 ? size.small : size.tiny
var t_position = in_loc == "Top" ? position.top_right : position.bottom_right
var cardinal = line.style_solid
var ordinal = line.style_dotted
var gann_ext = gann_sty == ext1 ? extend.none : extend.left
var w52_lsty = w52_sty == typ1 ? line.style_solid : w52_sty == typ2 ? line.style_dashed : line.style_dotted
var transp = in_color==col2 ? 80 : 100
var red = #FF0000
var green = #006600
if(barstate.isfirst and dark)
red := #FF3333
green := #00CC00
var head_col = dark ? color.white : color.white
var head_bgc = dark ? color.black : color.black
var text_col = dark ? color.white : color.black
var disp_key2 = disp_52w==_y or disp_gan==_y
var ma1_txt = MA1type +" "+ tostring(MA1len)
var ma2_txt = MA2type +" "+ tostring(MA2len)
var ma3_txt = MA3type +" "+ tostring(MA3len)
var ma4_txt = MA4type +" "+ tostring(MA4len)
var arrow_up = " ▲"
var arrow_dn = " ▼"
var line_list = array.new_line()
var lbl_list = array.new_label()
//Swing Marked Price
var markedprice = array.new_label()
var marked_base = 9
var marked_len = 9
var float cp = 0.0 //current pivot price
var string cs = "" //current swing type
var float lh = 0.0 // last high
var float ll = 0.0 // last low
bool sh_ = na
bool sl_ = na
// ▼▼▼▼▼▼▼▼▼▼▼▼▼▼▼▼▼▼▼▼▼▼▼▼▼▼▼▼▼▼▼▼▼▼▼▼▼▼▼▼▼▼▼▼▼▼▼▼▼▼▼▼▼▼▼▼▼▼▼▼▼▼▼▼▼▼▼▼▼▼▼▼▼▼▼▼▼▼▼▼▼▼▼▼▼▼▼▼▼▼▼▼▼▼▼▼▼▼▼▼▼▼▼▼▼▼▼▼▼▼▼▼▼▼▼▼▼▼▼▼▼▼▼▼
// Functions
// ▲▲▲▲▲▲▲▲▲▲▲▲▲▲▲▲▲▲▲▲▲▲▲▲▲▲▲▲▲▲▲▲▲▲▲▲▲▲▲▲▲▲▲▲▲▲▲▲▲▲▲▲▲▲▲▲▲▲▲▲▲▲▲▲▲▲▲▲▲▲▲▲▲▲▲▲▲▲▲▲▲▲▲▲▲▲▲▲▲▲▲▲▲▲▲▲▲▲▲▲▲▲▲▲▲▲▲▲▲▲▲▲▲▲▲▲▲▲▲▲▲▲▲▲
get_hi(len)=>
x = highest(high, len)
get_lo(len)=>
x = lowest(low, len)
get_52w_hi()=>
security(syminfo.tickerid, "W", get_hi(52))
get_52w_lo()=>
security(syminfo.tickerid, "W", get_lo(52))
f_norm(_val, _min, _max)=>
(_val-_min) / (_max-_min)
//-----------------------
// SuperSmoother Function
//-----------------------
supersmoother(_src, _length) =>
s_a1 = exp(-sqrt(2) * math.pi / _length)
s_b1 = 2 * s_a1 * cos(sqrt(2) * math.pi / _length)
s_c3 = -pow(s_a1, 2)
s_c2 = s_b1
s_c1 = 1 - s_c2 - s_c3
ss = 0.0
ss := s_c1 * _src + s_c2 * nz(ss[1], _src[1]) + s_c3 * nz(ss[2], _src[2])
get_MA(typ, len) =>
float maVal = na
if (typ == "EMA")
maVal := ema(close, len)
else if (typ == "MA")
maVal := sma(close, len)
else if (typ == "WMA")
maVal := wma(close, len)
else if (typ == "RMA")
maVal := rma(close, len)
else if (typ == "VWMA")
maVal := vwma(close, len)
else if(typ == "Super Smoother")
maVal := supersmoother(close, len)
maVal
get_dist(_val, _typ, _atr)=>
float dist = na
if(_typ == "%")
dist := (close-_val) / (reverse_dist==_y ? close : _val)
if(_typ == "ATR")
dist := abs((close-_val)) / _atr
dist
check_col(_val, _typ)=>
float atr = atr(14)
int res = 0 //0-None 1-Green(Above) 2-Red(Below)
bool above = false
bool below = false
if(in_color==col2)
if(_typ=="Tick")
// above := close > _val and close <= _val+(syminfo.mintick * 2)
// below := close <= _val and close >= _val-(syminfo.mintick * 2)
above := close > _val and close <= _val+(atr*0.5)
below := close <= _val and close >= _val-(atr*0.5)
if(_typ=="ATR")
above := close > _val and close <= _val+(atr)
below := close <= _val and close >= _val-(atr)
if(_typ=="52w")
above := _val >= 0.8
below := _val <= 0.2
res := above ? 1 : below ? 2 : 0
res
f_line(_val, _ext, _col, _style)=>
line l = line.new(x1 = max(bar_index-70, 0), x2 = bar_index+10, xloc=xloc.bar_index, y1 = _val, y2 = _val,
style = _style,
extend = _ext,
color = _col)
f_label(_txt, _yloc, _col) =>
label l2 = label.new(
x = bar_index+10, xloc = xloc.bar_index, y = _yloc,
text = _txt,
color = #00000000,
textcolor = _col,
size = text_size,
style = label.style_label_left,
textalign = text.align_left)
get_channel(src, _len)=>
intercept=0., endy=0., dev=0., slope=0.
mid = sum(src, _len) / _len
slope := linreg(src, _len, 0) - linreg(src, _len, 1)
if(disp_ocl==_y and barstate.islast)
intercept := mid - slope * floor(_len / 2) + ((1 - (_len % 2)) / 2) * slope
endy := intercept + slope * (_len - 1)
for x = 0 to _len - 1
dev := dev + pow(src[x] - (slope * (_len - x) + intercept), 2)
dev := sqrt(dev/_len)
[intercept, endy, dev, slope]
isbetween(n,min,max)=>
bool return = n>=min and n<=max ? true : na
f_degree(src, len, ref_len)=>
mid = sum(src, len) / len
slope = linreg(src, len, 0) - linreg(src, len, 1)
y1 = mid - slope * floor(len / 2) + ((1 - (len % 2)) / 2) * slope
y2 = y1 + slope * (len - 1)
h = highest(high, ref_len)
l = lowest(low, ref_len)
dx1 = f_norm(0, 0, ref_len)
dx2 = f_norm(len, 0, ref_len)
dy1 = f_norm(y1, l, h)
dy2 = f_norm(y2, l, h)
degree = todegrees(atan((dy2 - dy1)/(dx2-dx1)))
degree
f_label_markedprice(_y, _type, _atrmult, _chg)=>
sgn = _type == "H" ? 1 : -1
pct_chg = _chg ? ("("+(_chg>=0?"+":"")+tostring(_chg, format.percent)+")") : ""
price = tostring(_y, format.mintick)
label.new(
x = bar_index-marked_len,
y = _y + (_atrmult*sgn),
text = price +"\n"+ pct_chg,
xloc = xloc.bar_index,
yloc = yloc.price,
color = color.new(color.gray, 100),
style = _type=="H" ? label.style_label_down : label.style_label_up,
textcolor = dark ? color.white : color.black,
size = size.small)
// ▼▼▼▼▼▼▼▼▼▼▼▼▼▼▼▼▼▼▼▼▼▼▼▼▼▼▼▼▼▼▼▼▼▼▼▼▼▼▼▼▼▼▼▼▼▼▼▼▼▼▼▼▼▼▼▼▼▼▼▼▼▼▼▼▼▼▼▼▼▼▼▼▼▼▼▼▼▼▼▼▼▼▼▼▼▼▼▼▼▼▼▼▼▼▼▼▼▼▼▼▼▼▼▼▼▼▼▼▼▼▼▼▼▼▼▼▼▼▼▼▼▼▼▼
// Prepare Data
// ▲▲▲▲▲▲▲▲▲▲▲▲▲▲▲▲▲▲▲▲▲▲▲▲▲▲▲▲▲▲▲▲▲▲▲▲▲▲▲▲▲▲▲▲▲▲▲▲▲▲▲▲▲▲▲▲▲▲▲▲▲▲▲▲▲▲▲▲▲▲▲▲▲▲▲▲▲▲▲▲▲▲▲▲▲▲▲▲▲▲▲▲▲▲▲▲▲▲▲▲▲▲▲▲▲▲▲▲▲▲▲▲▲▲▲▲▲▲▲▲▲▲▲▲
//-----------------------------------------
// Volume & Volatility
//-----------------------------------------
_volume = vol_typ==_y ? volume*close : volume
_voltxt = vol_typ==_y ? "DNV" : "Volume"
float rel_vol = na
float bts_vol = na
float atr = atr(atr_len)
float a_atr = rma(atr,7)
float avg_vol = sma(_volume[1],vol_len)
float vprice = na
ud_len = timeframe.isweekly ? min(bar_index, 10) : min(bar_index, 50)
upvol = sum(close>=open ? nz(_volume) : 0, max(ud_len,1))
dnvol = sum(close<open ? nz(_volume) : 0, max(ud_len,1))
if(volume)
rel_vol := _volume/avg_vol
vprice := avg_vol
bts_vol := upvol/dnvol
atr_p = " (" + tostring(atr/close[1], "0.00%") + ")"
volatility = atr > a_atr ? "Increasing" : "Decreasing"
//-----------------------------------------
// MA Distance
//-----------------------------------------
MA1 = get_MA(MA1type, MA1len)
MA2 = get_MA(MA2type, MA2len)
MA3 = get_MA(MA3type, MA3len)
MA4 = get_MA(MA4type, MA4len)
string ma1_dir = na
string ma2_dir = na
string ma3_dir = na
string ma4_dir = na
ma1_dir := close > MA1 ? arrow_up : close < MA1 ? arrow_dn : ma1_dir[1]
ma2_dir := close > MA2 ? arrow_up : close < MA2 ? arrow_dn : ma2_dir[1]
ma3_dir := close > MA3 ? arrow_up : close < MA3 ? arrow_dn : ma3_dir[1]
ma4_dir := close > MA4 ? arrow_up : close < MA4 ? arrow_dn : ma4_dir[1]
ma1dist = get_dist(MA1, MAtype, atr)
ma2dist = get_dist(MA2, MAtype, atr)
ma3dist = get_dist(MA3, MAtype, atr)
ma4dist = get_dist(MA4, MAtype, atr)
string dist1_text = na
string dist2_text = na
string dist3_text = na
string dist4_text = na
if(MAtype == "%")
dist1_text := tostring(ma1dist, "0.##%") + ma1_dir
dist2_text := tostring(ma2dist, "0.##%") + ma2_dir
dist3_text := tostring(ma3dist, "0.##%") + ma3_dir
dist4_text := tostring(ma4dist, "0.##%") + ma4_dir
if(MAtype == "ATR")
dist1_text := tostring(ma1dist, format.mintick) + " ATR" + ma1_dir
dist2_text := tostring(ma2dist, format.mintick) + " ATR" + ma2_dir
dist3_text := tostring(ma3dist, format.mintick) + " ATR" + ma3_dir
dist4_text := tostring(ma4dist, format.mintick) + " ATR" + ma4_dir
//-----------------------------------------
// Key Level
//-----------------------------------------
// .............
// 52 Week
// .............
float hi52 = get_52w_hi()
float hi52pct = (hi52-close) / close
float lo52 = get_52w_lo()
float lo52pct = (close-lo52) / close
float pct52 = (close-lo52) / (hi52-lo52)
// .............
// Gann
// .............
denomenator=0.0
if barstate.islast
if close >= 10000
denomenator :=0.01
else if close >= 1000
denomenator :=0.1
else if close >= 100
denomenator :=1
else if close >=10
denomenator :=10
else if close >=0.05
denomenator :=100
else
denomenator :=1000
mult = denomenator //close<100 ? 100 : 1
src = close*mult
var table_size = 1200
var gann_table = array.new_float()
int r_loc = na, int s_loc = na
// Generate Gann Table
//--Initial value
val = 1
increment = 1
diag_check = 3
if(barstate.isfirst)
array.push(gann_table, 1)
for cnt = 0 to table_size-1
val := val+increment
array.push(gann_table, val)
if(val==pow(diag_check,2))
increment += 1
diag_check += 2
string set_gann = na
set_gann := close > close[1] ? "R" : close < close[1] ? "S" : set_gann[1]
// Gann Calculation
if barstate.islast
int idx = array.indexof(gann_table, src)
float tmp = 0
// if src==gann
if(idx!=-1)
if(set_gann=="R")
r_loc := idx
s_loc := idx-1 < 0 ? na : idx-1
if(set_gann=="S")
r_loc := idx+1
s_loc := idx
else
for cnt = 0 to (array.size(gann_table)-1)
tmp := array.get(gann_table, cnt)
if(tmp>src and not r_loc)
r_loc := cnt
s_loc := cnt-1
r_list = array.new_float()
s_list = array.new_float()
r_txt = array.new_string()
s_txt = array.new_string()
var totalline = gann_no
for i=0 to totalline-1
float r_val = r_loc + i < 0 or r_loc + i > table_size-1 ? na : round_to_mintick(array.get(gann_table, r_loc + i)/mult)
float s_val = s_loc - i < 0 or s_loc - i > table_size-1 ? na : round_to_mintick(array.get(gann_table, s_loc - i)/mult)
if(r_val)
array.push(r_list, r_val)
array.push(r_txt, "R"+tostring(i+1, "# ("))
if(s_val)
array.push(s_list, s_val)
array.push(s_txt, "S"+tostring(i+1, "# ("))
float gann_r2 = r_loc + 1 < 0 or r_loc + 1 > table_size-1 ? na : round_to_mintick(array.get(gann_table, r_loc + 1)/mult)
float gann_r1 = r_loc + 0 < 0 or r_loc + 0 > table_size-1 ? na : round_to_mintick(array.get(gann_table, r_loc + 0)/mult)
float gann_s1 = s_loc - 0 < 0 or s_loc - 0 > table_size-1 ? na : round_to_mintick(array.get(gann_table, s_loc - 0)/mult)
float gann_s2 = s_loc - 1 < 0 or s_loc - 1 > table_size-1 ? na : round_to_mintick(array.get(gann_table, s_loc - 1)/mult)
string r2_dist = na(gann_r2) ? na : " (" + tostring(((gann_r2 - close)/close)*100, format.percent) + ")"
string r1_dist = na(gann_r1) ? na : " (" + tostring(((gann_r1 - close)/close)*100, format.percent) + ")"
string s1_dist = na(gann_s1) ? na : " (" + tostring(((gann_s1 - close)/close)*100, format.percent) + ")"
string s2_dist = na(gann_s2) ? na : " (" + tostring(((gann_s2 - close)/close)*100, format.percent) + ")"
string r2_typ = ((r_loc + 1)%2) == 1 ? " (c)" : na
string r1_typ = ((r_loc + 0)%2) == 1 ? " (c)" : na
string s1_typ = ((s_loc - 0)%2) == 1 ? " (c)" : na
string s2_typ = ((s_loc - 1)%2) == 1 ? " (c)" : na
//-----------------------------------------
// StopLoss Level
//-----------------------------------------
float atr_cl = max(round_to_mintick(close - (atr*in_atrcl)), syminfo.mintick)
float risk = 1-(in_pctcl/100)
float pct_cl = max(round_to_mintick(close*risk), syminfo.mintick)
float sell_price = in_caltype=="%" ? pct_cl : atr_cl
float price_diff = close - sell_price
int cal_unit = floor(in_calamt/price_diff)
int buy_unit = in_calres == "Lot" ? floor(cal_unit/(in_callot)) : cal_unit
float cal_cost = floor(cal_unit/(in_callot))*100 * close
var cal_txt = "Suggested "+in_calres+"\nBased on "+ (in_caltype=="%" ? (tostring(in_pctcl, "0.#")+"% Stop") : (tostring(in_atrcl, "#.#")+" ATR Stop"))
//------------------------------------------------------------------------------
// Risk Envelope
//------------------------------------------------------------------------------
float risk_res = na, float risk_sup = na, string risk_txt = "S"
var p_hi = array.new_float()
var p_lo = array.new_float()
var risk_array_size = 12
var risk_treshold = 2.
risk_basis = supersmoother(close, 40)
risk_h = (high-risk_basis) / atr
risk_l = (low-risk_basis) / atr
pvthi_ = pivothigh(risk_h, 10, 10), pvthi = pvthi_ > risk_treshold ? pvthi_ : na
pvtlo_ = pivotlow(risk_l, 10, 10), pvtlo = pvtlo_ < -risk_treshold ? pvtlo_ : na
// keep each peak in array
if(barstate.isconfirmed)
if(pvthi>0)
if(array.size(p_hi) >= risk_array_size)
array.shift(p_hi) // remove oldest
array.push(p_hi, pvthi) // insert new
if(pvtlo<0)
if(array.size(p_lo) >= risk_array_size)
array.shift(p_lo) // remove oldest
array.push(p_lo, pvtlo) // insert new
var risk_lim = 0.7
if (barstate.islast)
// Get the range based on average of historical peak
risk_res := risk_basis+(max(array.avg(p_hi), 2.0)*atr)
risk_sup := risk_basis+(min(array.avg(p_lo), -2.0)*atr)
if(close > risk_basis)
if(f_norm(close, risk_basis, risk_res) > 1.0)
risk_txt := "Over\nExtended ▲"
else if(f_norm(close, risk_basis, risk_res) > risk_lim)
risk_txt := "Extended ▲\n(Slightly)"
else
risk_txt := "Within Range"
else if(close < risk_basis)
if(f_norm(close, risk_sup, risk_basis) < -1.)
risk_txt := "Over\nExtended ▼"
else if(f_norm(close, risk_sup, risk_basis) < 1.-risk_lim)
risk_txt := "Extended ▼\n(Slightly)"
else
risk_txt := "Within Range"
else
risk_txt := "Within Range"
//------------------------------------------------------------------------------
// Optimized Linear Regression Channel
//------------------------------------------------------------------------------
var olr_devlen = 2.
var olr_shortlen = 50
var olr_midlen = 120
var olr_longlen = 200
string trend = "na"
var hi_tres = 10.
var lo_tres = -10.
stoch = stoch(close, high, low, 14)
[olr_y1_, olr_y2_, olr_dev, olr_slope] = get_channel(close, olr_longlen)
[mid_y1_, mid_y2_, mid_dev, mid_slope] = get_channel(close, olr_midlen)
[short_y1_, short_y2_, short_dev, short_slope] = get_channel(close, olr_shortlen)
short = f_degree(close, olr_shortlen, olr_longlen)
mid = f_degree(close, olr_midlen, olr_longlen)
long = f_degree(close, olr_longlen, olr_longlen)
if(barstate.islast)
if(isbetween(long, lo_tres, hi_tres))
if(isbetween(mid, lo_tres, hi_tres))
trend := "Sideway"
else if(mid>hi_tres and short>10)
trend := "Sideway\n(Bullish)"
else if (close > olr_y2_ + (olr_dev * olr_devlen))
trend := "Sideway\n(Bullish)"
else if(mid<lo_tres and short < -10)
trend := "Sideway\n(Bearish)"
else if (close < olr_y2_ - (olr_dev * olr_devlen))
trend := "Sideway\n(Bearish)"
else
trend := "Sideway"
//----------------------------------------------------------------------------------------------------------------------
//Long above 20 degree
else if(long>=hi_tres)
if(long>=20)
if(mid>=long)
if (short<0)
trend := "Uptrend"
else if(short<-15)
trend := "Uptrend\n(Pullback)"
else
trend := "Strong Uptrend"
if(mid<long)
if (short<0)
trend := "Uptrend"
else if(short<-15)
trend := "Uptrend\n(Pullback)"
else
trend := "Uptrend"
//---------------------------------------------------------------
//Long Between treshold and 20 degree
else if(mid>=0)
if(mid>=long)
if (short>=mid)
trend := "Uptrend"
else if(short>0)
trend := "Uptrend"
else if(short<-15)
trend := "Uptrend\n(Pullback)"
else
trend := "Weak Uptrend"
else if(mid<=long)
if (short>=mid)
trend := "Uptrend"
else if(short>0)
trend := "Weak Uptrend"
else if(short<-10)
trend := "Weak Uptrend\n(Pullback)"
else
trend := "Weak Uptrend"
//---------------------------------------------------------------
else if(mid<0)
if(isbetween(short, -10., 10.))
trend := "Weak Uptrend"
if(short<=10)
trend := "Weak Uptrend\n(Potential Reversal)"
else if(short>=10)
trend := "Weak Uptrend\n(Continuation)"
//----------------------------------------------------------------------------------------------------------------------
//Short below -20 degree
else if(long<=lo_tres)
if(long<=-20)
if(mid<=long)
if (short>0)
trend := "Downtrend"
else if(short>15)
trend := "Downtrend\n(Recovery)"
else
trend := "Strong Downtrend"
if(mid>long)
if (short>0)
trend := "Downtrend"
else if(short>15)
trend := "Downtrend\n(Recovery)"
else
trend := "Downtrend"
//---------------------------------------------------------------
//Short between treshold and -20 degree
else if(mid<=0)
if(mid<=long)
if (short<=mid)
trend := "Downtrend"
else if(short<0)
trend := "Downtrend"
else if(short>10)
trend := "Downtrend\n(Recovery)"
else
trend := "Weak Downtrend"
else if(mid>=long)
if (short<=mid)
trend := "Downtrend"
else if(short<0)
trend := "Weak Downtrend"
else if(short>0)
trend := "Weak Downtrend\n(Recovery)"
else if(mid>0)
if(isbetween(short, -10., 10.))
trend := "Weak Downtrend"
else if(short>=10)
trend := "Weak Downtrend\n(Potential Reversal)"
else if(short<=10)
trend := "Weak Downtrend\n(Continuation)"
//--------------------------------------------------------------------------------------------
else
trend:="Insufficient Data"
olr_strength = trend
//------------------------------------------------------------------------------
// Swing point (Marked Price)
//------------------------------------------------------------------------------
ph_ = pivothigh(high, marked_base, marked_len)
pl_ = pivotlow(low, marked_base, marked_len)
if ph_ and (cs=="L" or (cs=="H" and ph_ > cp) or cs=="")
cp := ph_
cs := "H"
sh_ := true
lh := ph_
if pl_ and (cs=="H" or (cs=="L" and pl_ < cp) or cs=="")
cp := pl_
cs := "L"
sl_ := true
ll := pl_
//------------------------------------------------------------------------------
// T+
//------------------------------------------------------------------------------
res20 = highest(high[1], 20)
var tplus = 0
var tvol = 0.
avg_tvol = sma(volume, 20)
if high > res20 and volume > avg_tvol
tplus := 0
tvol := volume
else if high == res20 and volume > avg_tvol
if volume >= tvol
tplus := 0
else
tplus += 1
else
tplus+=1
tplus_txt = tplus>30?"N/A":("T"+tostring(min(tplus, 30)))
// ▼▼▼▼▼▼▼▼▼▼▼▼▼▼▼▼▼▼▼▼▼▼▼▼▼▼▼▼▼▼▼▼▼▼▼▼▼▼▼▼▼▼▼▼▼▼▼▼▼▼▼▼▼▼▼▼▼▼▼▼▼▼▼▼▼▼▼▼▼▼▼▼▼▼▼▼▼▼▼▼▼▼▼▼▼▼▼▼▼▼▼▼▼▼▼▼▼▼▼▼▼▼▼▼▼▼▼▼▼▼▼▼▼▼▼▼▼▼▼▼▼▼▼▼
// Prepare Dashboard
// ▲▲▲▲▲▲▲▲▲▲▲▲▲▲▲▲▲▲▲▲▲▲▲▲▲▲▲▲▲▲▲▲▲▲▲▲▲▲▲▲▲▲▲▲▲▲▲▲▲▲▲▲▲▲▲▲▲▲▲▲▲▲▲▲▲▲▲▲▲▲▲▲▲▲▲▲▲▲▲▲▲▲▲▲▲▲▲▲▲▲▲▲▲▲▲▲▲▲▲▲▲▲▲▲▲▲▲▲▲▲▲▲▲▲▲▲▲▲▲▲▲▲▲▲
var PTable = table.new(position = t_position,
columns = 3+in_gap,
rows = 45,
bgcolor = #00000000,
frame_color = #000000,
frame_width = 0,
border_color = #000000,
border_width = 0)
// fill table
// =====================================================================================================================
f_Fill(_table, _row, _label, _value, _clrtyp) =>
t_size = text_size
header = _value=="Header" ? true : false
col_text = header ? head_col : _clrtyp == 0 ? text_col : _clrtyp == 1 ? green : red
col_bg = header ? head_bgc : _clrtyp == 0 ? #00000000 : _clrtyp == 1 ? color.new(green, transp) : color.new(red, transp)
_ValueText = header ? "" : _value == "gap" ? "" : _value
table.cell(_table, 0, _row, _label, bgcolor = col_bg, text_color = col_text,
text_size = text_size, text_halign = header ? text.align_left : text.align_left)
table.cell(_table, 1, _row, _ValueText == "" ? "" : ":", bgcolor = col_bg, text_color = header?head_col:col_text,
text_size = text_size, text_halign = text.align_center)
table.cell(_table, 2, _row, _ValueText, bgcolor = col_bg, text_color = header?head_col:col_text,
text_size = text_size, text_halign = text.align_right)
if(in_gap>0)
for k=1 to in_gap
table.cell(_table, 2+k, _row, "-", bgcolor = #00000000, text_color = #00000000,
text_size = size.tiny, text_halign = text.align_center)
// =====================================================================================================================
// Set Col
ma1_col = check_col(MA1, "ATR")
ma2_col = check_col(MA2, "ATR")
ma3_col = check_col(MA3, "ATR")
ma4_col = check_col(MA4, "ATR")
gannr1_col = check_col(gann_r1, "Tick")
gannr2_col = check_col(gann_r2, "Tick")
ganns1_col = check_col(gann_s1, "Tick")
ganns2_col = check_col(gann_s2, "Tick")
hi52w_col = check_col(pct52, "52w")
lo52w_col = check_col(pct52, "52w")
hi52w_col := pct52 > 0.5 ? hi52w_col : 0
lo52w_col := pct52 < 0.5 ? lo52w_col : 0
sc52w_col = check_col(pct52, "52w")
// Fill table
i = -1
if barstate.islast and proversion==true
if(disp_vol)
if(avg_vol or (atr and atr_triv==_y))
i += 1, f_Fill(PTable, i, "Volume & Volatility", "Header", 0)
if(_volume and vol_triv==_y)
i += 1, f_Fill(PTable, i, _voltxt, tostring(_volume, format.volume), 0)
if(avg_vol)
if(vol_triv==_y)
i += 1, f_Fill(PTable, i, "Avg "+_voltxt, tostring(vprice, format.volume), 0)
i += 1, f_Fill(PTable, i, "Relative "+_voltxt, tostring(rel_vol, "0.00"), 0)
i += 1, f_Fill(PTable, i, "Buy to Sell Ratio", tostring(bts_vol, "0.00"), 0)
if(atr and atr_triv==_y)
i += 1, f_Fill(PTable, i, "ATR", tostring(atr, format.mintick)+atr_p, 0)
i += 1, f_Fill(PTable, i, "Volatility", volatility, 0)
i += 1, f_Fill(PTable, i, "", "gap", 0)
if(disp_ta and ((disp_risk == _y and bar_index>40) or (disp_ocl == _y and bar_index>120)or (disp_tplus == _y and volume and bar_index>=20)))
i += 1, f_Fill(PTable, i, "Trend Analysis", "Header", 0)
if(disp_risk == _y and bar_index>40)
i += 1, f_Fill(PTable, i, "Shortterm Risk\n(MA 20)", risk_txt, 0)
if(disp_ocl == _y and bar_index>120)
i += 1, f_Fill(PTable, i, "Trend Estimator", olr_strength, 0)
if(disp_tplus == _y and volume and bar_index>=20)
i += 1, f_Fill(PTable, i, "T+", tplus_txt, 0)
i += 1, f_Fill(PTable, i, "", "gap", 0)
if(disp_trnd)
if((MAtype=="ATR" and atr) or MAtype=="%")
if(MA1 or MA2 or MA3 or (MA4 and show_ma4==_y))
i += 1, f_Fill(PTable, i, "MA (Distance)", "Header", 0)
if(MA1)
i += 1, f_Fill(PTable, i, ma1_txt, dist1_text, ma1_col)
if(MA2)
i += 1, f_Fill(PTable, i, ma2_txt, dist2_text, ma2_col)
if(MA3)
i += 1, f_Fill(PTable, i, ma3_txt, dist3_text, ma3_col)
if(MA4 and show_ma4==_y)
i += 1, f_Fill(PTable, i, ma4_txt, dist4_text, ma4_col)
i += 1, f_Fill(PTable, i, "", "gap", 0)
if(disp_key and disp_key2)
i += 1, f_Fill(PTable, i, "Key Levels", "Header", 0)
if(hi52 and disp_52w==_y)
i += 1, f_Fill(PTable, i, "52week High", tostring(hi52, format.mintick) + " (" + tostring(hi52pct, "0.00%")+")", hi52w_col)
i += 1, f_Fill(PTable, i, "52week Low", tostring(lo52, format.mintick) + " (" + tostring(lo52pct, "0.00%")+")", lo52w_col)
i += 1, f_Fill(PTable, i, "52week Range(%)", tostring(pct52*100, "#.##"), sc52w_col)
i += 1, f_Fill(PTable, i, "", "gap", 0)
if(disp_gan==_y)
i += 1, f_Fill(PTable, i, "Gann R2"+r2_typ, tostring(gann_r2, format.mintick)+r2_dist, gannr2_col)
i += 1, f_Fill(PTable, i, "Gann R1"+r1_typ, tostring(gann_r1, format.mintick)+r1_dist, gannr1_col)
i += 1, f_Fill(PTable, i, "Gann S1"+s1_typ, tostring(gann_s1, format.mintick)+s1_dist, ganns1_col)
i += 1, f_Fill(PTable, i, "Gann S2"+s2_typ, tostring(gann_s2, format.mintick)+s2_dist, ganns2_col)
i += 1, f_Fill(PTable, i, "", "gap", 0)
if(disp_cl)
i += 1, f_Fill(PTable, i, "StopLoss Levels", "Header", 0)
i += 1, f_Fill(PTable, i, tostring(in_pctcl, "0.#")+"% Stop", tostring(pct_cl, format.mintick), 0)
if(atr)
i += 1, f_Fill(PTable, i, tostring(in_atrcl, "0.#")+" ATR Stop", tostring(atr_cl, format.mintick), 0)
if(disp_cal==_y)
i += 1, f_Fill(PTable, i, "", "gap", 0)
i += 1, f_Fill(PTable, i, cal_txt, tostring(buy_unit, "#,###")+" "+in_calres, 0)
i += 1, f_Fill(PTable, i, "Cost", syminfo.currency+tostring(cal_cost, " #,###,##0.00"), 0)
//--------------------------------
plot(disp_ma1 ? MA1 : na, title="MA 1", color=ma1_pcol)
plot(disp_ma2 ? MA2 : na, title="MA 2", color=ma2_pcol)
plot(disp_ma3 ? MA3 : na, title="MA 3", color=ma3_pcol)
plot(disp_ma4 ? MA4 : na, title="MA 4", color=ma4_pcol)
if atr and disp_mark and proversion==true
if sh_
_pv = high[marked_len]
changes = (_pv - ll) / ll * 100
array.push(markedprice, f_label_markedprice(_pv, "H", atr*0.5, changes))
if sl_
_pv = low[marked_len]
changes = (_pv - lh) / lh * 100
array.push(markedprice, f_label_markedprice(_pv, "L", atr*0.5, changes))
var reglines = array.new_line()
if(barstate.islast and proversion==true)
if(array.size(line_list) > 0)
for z = 0 to array.size(line_list)-1
oldline = array.shift(line_list)
line.delete(oldline)
if(array.size(lbl_list) > 0)
for z = 0 to array.size(lbl_list)-1
oldlbl = array.shift(lbl_list)
label.delete(oldlbl)
if(disp_52wl)
array.push(line_list, f_line(hi52, extend.both, w52_col, w52_lsty))
array.push(line_list, f_line(lo52, extend.both, w52_col, w52_lsty))
if(disp_ganl)
if(array.size(r_list)>0)
for k=0 to (array.size(r_list)-1)
rline_typ = (r_loc+k)%2==1 ? cardinal : ordinal
gann_r = array.get(r_list, k)
array.push(line_list, f_line(gann_r, gann_ext, gann_col, rline_typ))
array.push(lbl_list, f_label(array.get(r_txt, k)+tostring(gann_r, format.mintick)+")", gann_r, gann_col))
if(array.size(s_list)>0)
for k=0 to (array.size(s_list)-1)
sline_typ = (s_loc-k)%2==1 ? cardinal : ordinal
gann_s = array.get(s_list, k)
array.push(line_list, f_line(gann_s, gann_ext, gann_col, sline_typ))
array.push(lbl_list, f_label(array.get(s_txt, k)+tostring(gann_s, format.mintick)+")", gann_s, gann_col))
if(disp_ocl_l==_y or disp_ocl_m==_y or disp_ocl_s==_y)
if array.size(reglines) > 0
for j=0 to array.size(reglines)-1
o_ln = array.pop(reglines)
line.delete(o_ln)
for x = 0 to 2
olr_linestyle = x % 2 == 1 ? line.style_solid : line.style_dotted
if (disp_ocl_l==_y)
array.push(reglines,
line.new(x1 = bar_index - (olr_longlen - 1),
y1 = olr_y1_ + olr_dev * olr_devlen * (x - 1),
x2 = bar_index,
y2 = olr_y2_ + olr_dev * olr_devlen * (x - 1),
color = color.from_gradient(long, -80, 80, #FF3333, #00CC00),
style = olr_linestyle,
width = x % 2 == 1 ? 2 : 1,
extend = extend.none))
if (disp_ocl_m==_y)
array.push(reglines,
line.new(x1 = bar_index - (olr_midlen - 1),
y1 = mid_y1_ + mid_dev * olr_devlen * (x - 1),
x2 = bar_index,
y2 = mid_y2_ + mid_dev * olr_devlen * (x - 1),
color = color.from_gradient(mid, -80, 80, #FF3333, #00CC00),
style = olr_linestyle,
width = x % 2 == 1 ? 2 : 1,
extend = extend.none))
if (disp_ocl_s==_y)
array.push(reglines,
line.new(x1 = bar_index - (olr_shortlen - 1),
y1 = short_y1_ + short_dev * olr_devlen * (x - 1),
x2 = bar_index,
y2 = short_y2_ + short_dev * olr_devlen * (x - 1),
color = color.from_gradient(short, -80, 80, #FF3333, #00CC00),
style = olr_linestyle,
width = x % 2 == 1 ? 2 : 1,
extend = extend.none))
var DemoTable = table.new(position = t_demo,
columns = 1,
rows = 1,
bgcolor = #00000000,
frame_color = #000000,
frame_width = 0,
border_color = #000000,
border_width = 0)
if(barstate.islast and proversion==false)
table.cell(DemoTable, 0, 0, "Demo Version only available for\nStocks: 4-Hour Chart\nOthers: 30Minutes Chart", text_color=color.red, text_size=size.large, text_halign=text.align_left)